Introduction
A tremendous amount of proteomic and phosphoproteomic data has been produced over the years with the development of mass spectrometry techniques, providing us with new opportunities to explore and understand the proteome and phosphoproteome as well as the function of proteins and protein phosphorylation sites. However, lacking of powerful tools that we can utilize to explore these valuable data limits our understanding of the proteome and phosphoproteome, particularly in diseases, such as cancer. To address these unmet needs, we established CPPA (Cancer Proteome and Phosphoproteome Atlas), a web tool to mine abnormality of the proteome and phosphoproteome in cancer based on published datasets. All analysis results are presented in CPPA with a flexible web interface to provide key customization utilities, including general analysis, differential expression profiling, statistical analysis of protein phosphorylation sites, correlation analysis, similarity analysis, survival analysis, pathological stage analysis, etc. CPPA greatly facilitates the process of data mining and therapeutic target discovery by providing a comprehensive analysis of proteomic and phosphoproteomic data in normal and tumor tissues with a simple click, which helps to unlock the precious value of mass spectrometry data by bridging the gap between raw data and experimental biologists.
Analysis Module
Functionalities of CPPA are divided into multiple major modules: General analysis, Differential profile, Protein phosphorylation analysis, Custom expression analysis, Correlation analysis, Similarity analysis, and Survival analysis.
General Analysis
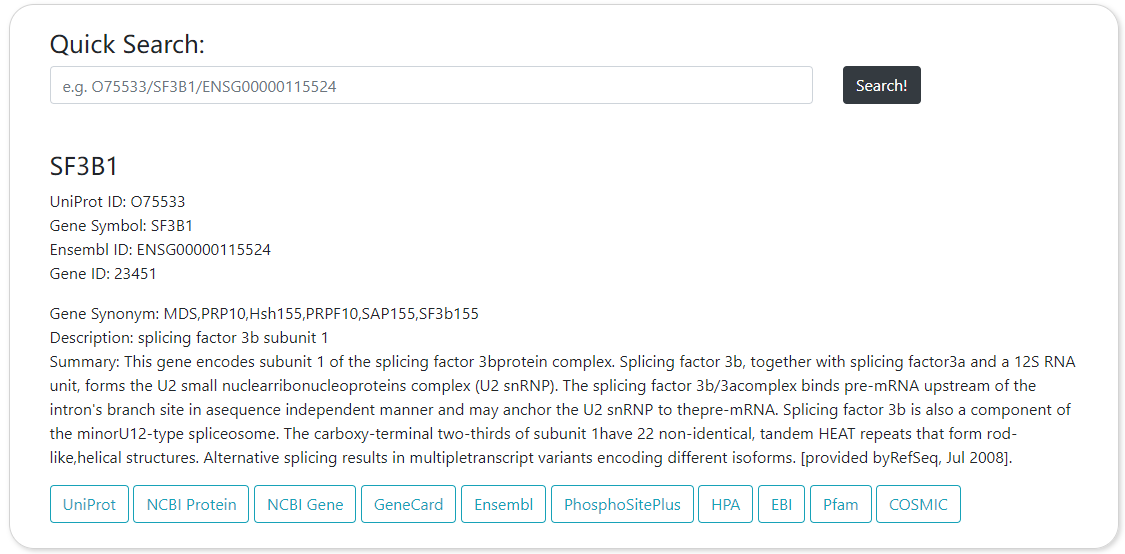
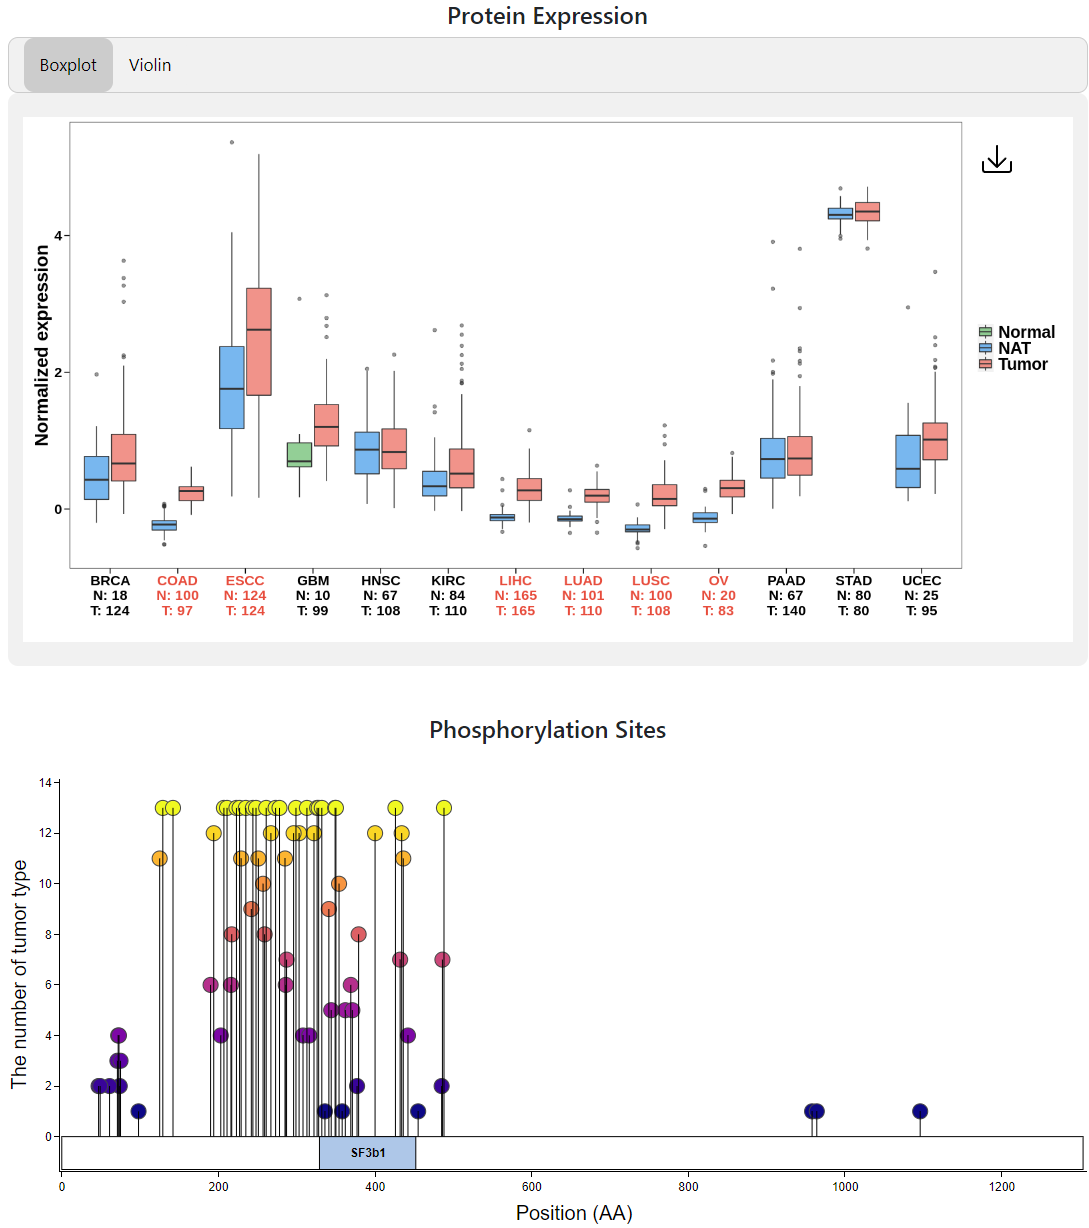
Index of CPPA provides a simple query interface that takes Gene Symbol (eg: SF3B1), UniPort ID (eg: O75533), or Ensembl ID (eg: ENSG00000115524) as input. After entering an identifier and clicking the ‘Search!’ button, the website will navigate to pan-cancer analysis webpage, which presents the protein expression profile by box plot or violin plot and the distribution of phosphorylation sites through lollipop plot across all cancer types.
Differential Profile
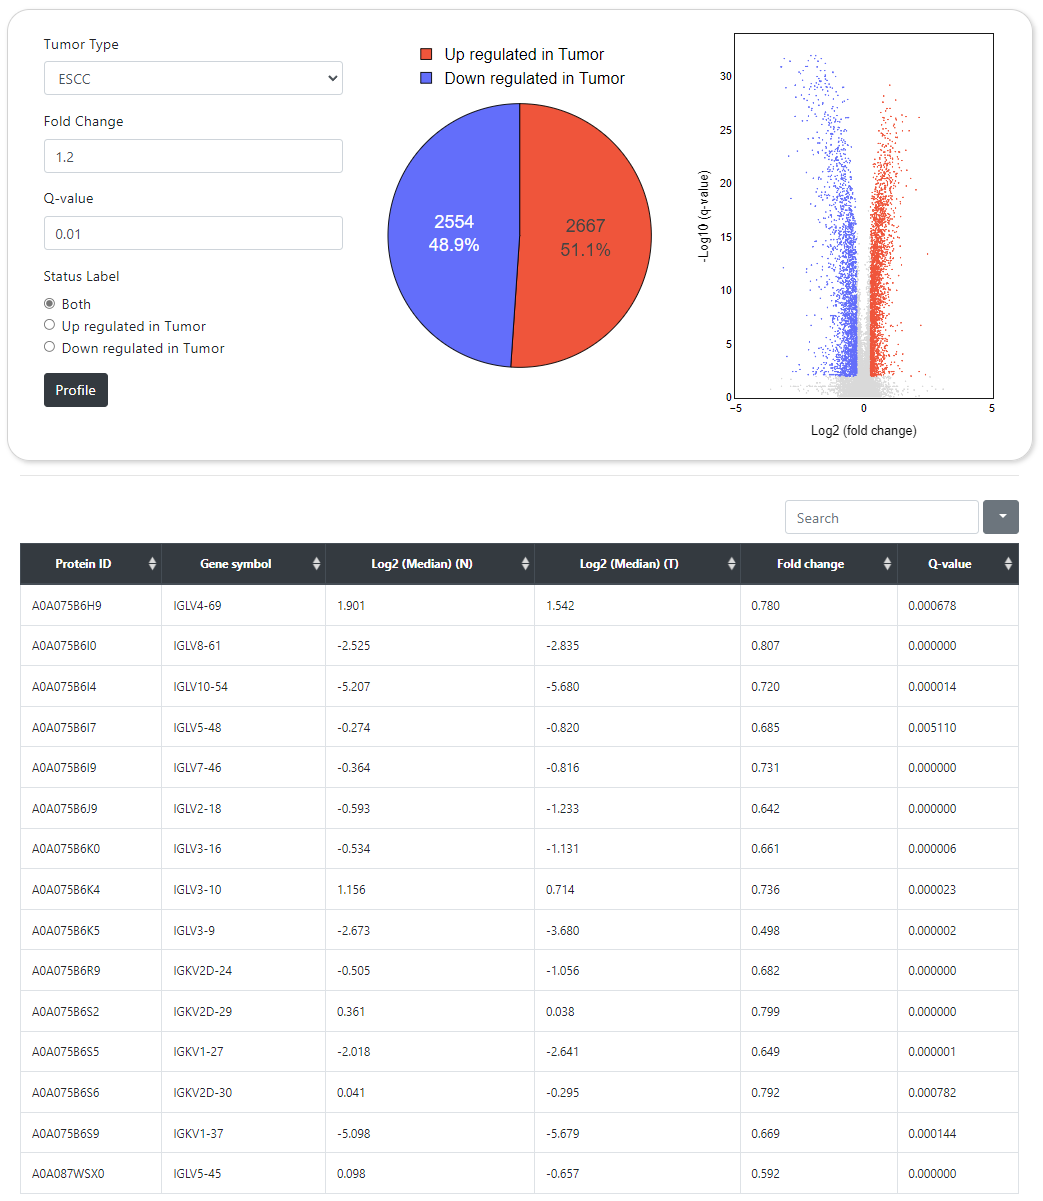
CPPA provides an interface for exhibiting differential abundance profiles for proteins and protein phosphorylation. The significance of differences was calculated between normal and tumor samples by using the Wilcoxon signed-rank test, and then the Benjamini-Hochberg tutorial were applied to correct the P-values for better accuracy. This module allows users to obtain the differential expression profiles of tens of thousands of proteins and protein phosphorylation sites in normal and tumor samples according to user-specified P-value and fold change cutoffs.
Phosphosites In Protein
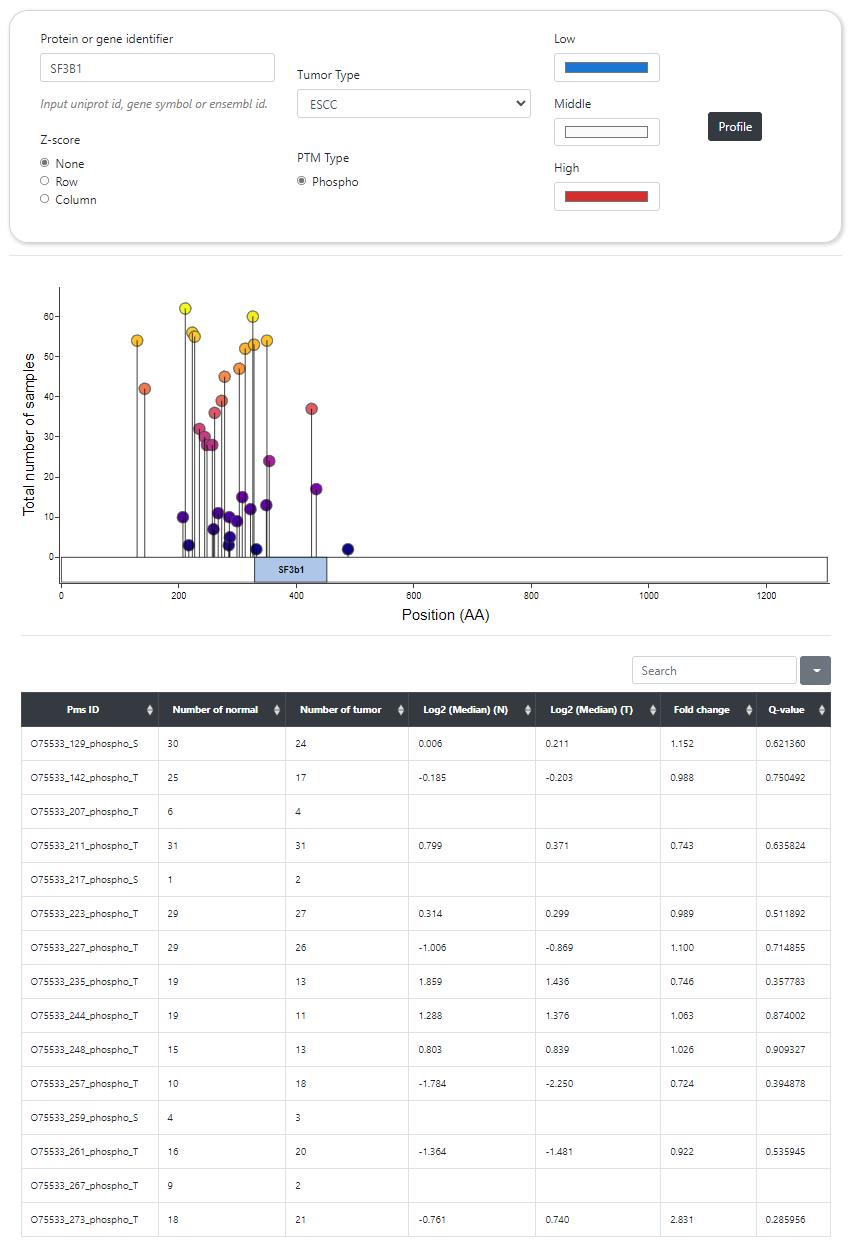
CPPA provides an interface that allows users to query all phosphorylation sites of a specific protein in a particular cancer type. The lollipop plot exhibits the distribution of phosphorylation sites on the protein, and the number of tissue samples in which these sites were identified. The heat map shows log2-transformed median abundance of phosphorylation sites across all normal and tumor tissues.
Custom Expression
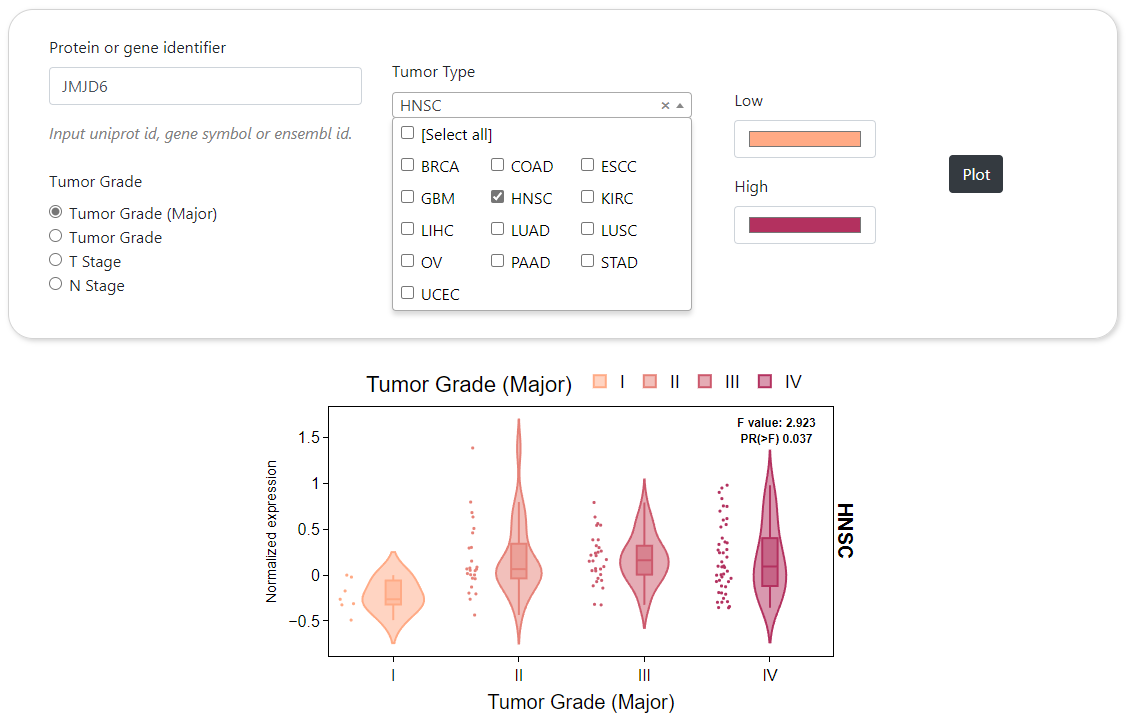
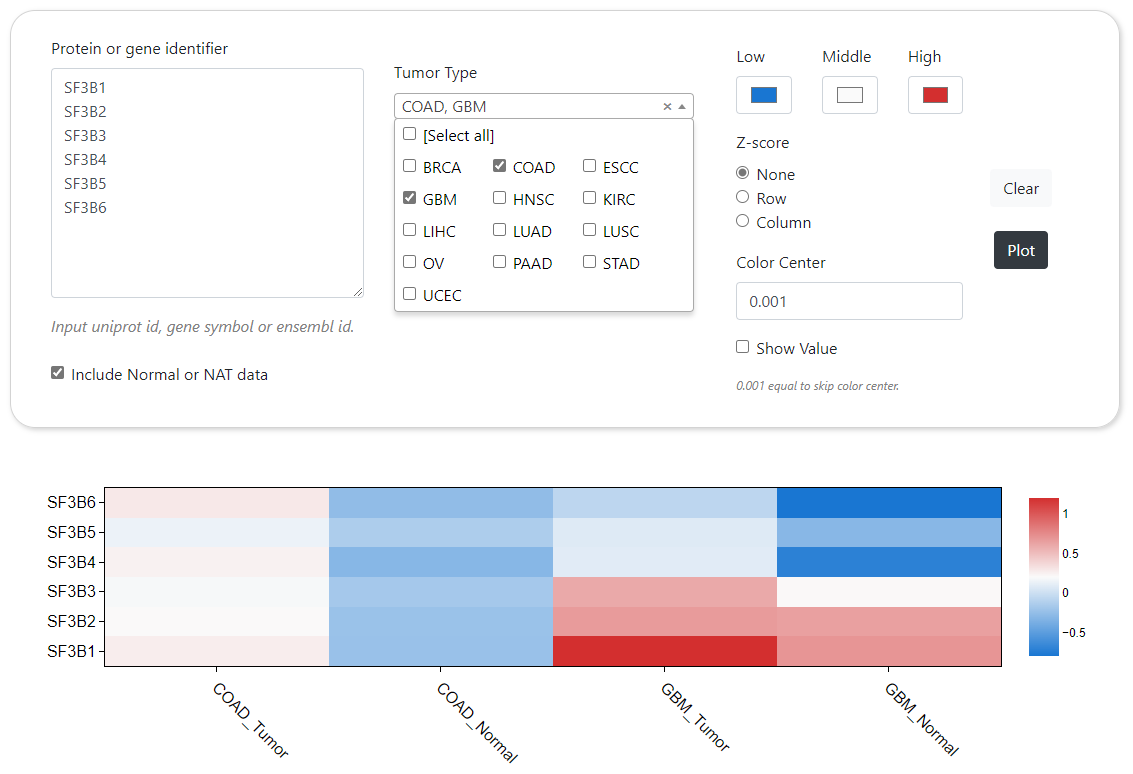
CPPA provides a module to dynamically generate the abundance profile of a given protein or protein phosphorylation sites based on user-defined cancer type. The results are visualized by box plot along with text summarizing the detailed statistical results and the number of samples. In addition, CPPA also provides an interface for mapping expression abundance with pathological stage based on structured patient clinical annotations. Furthermore, comparison of different proteins or phosphorylation sites across multiple cancer types can be done in CPPA website, and the analysis results will be shown by heat map.
Boxplot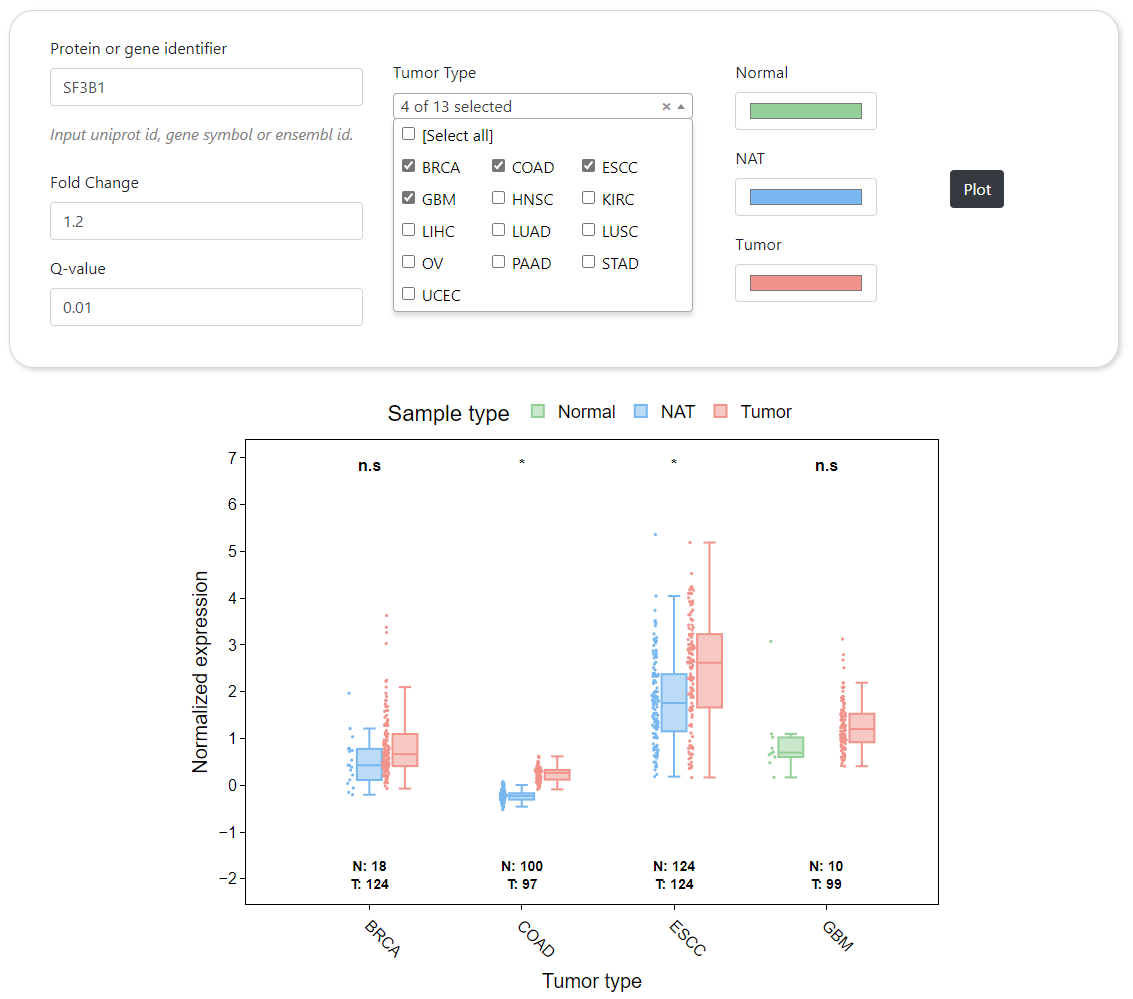
Stageplot
Heatmap
Similarity Analysis
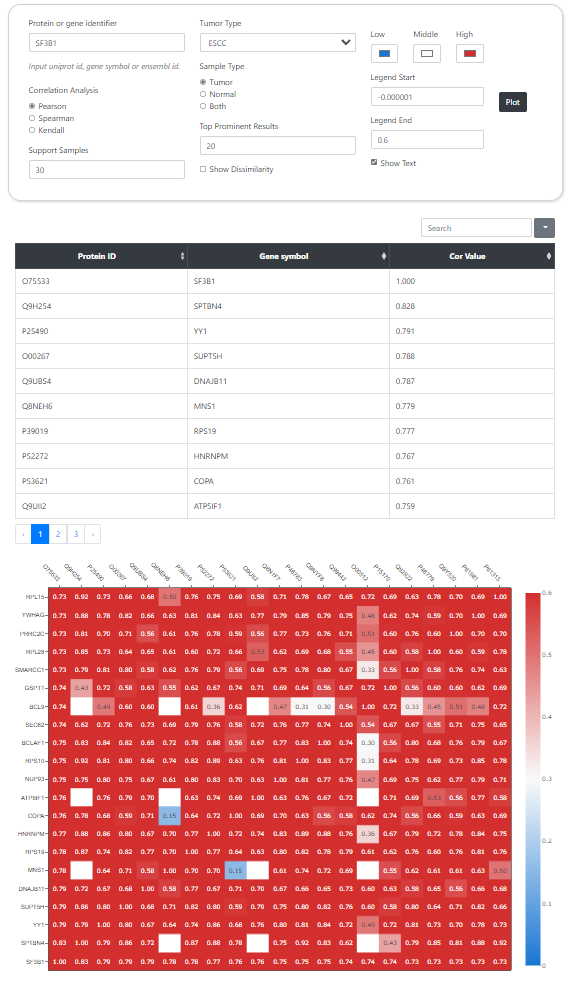
CPPA provides a module for correlation analysis of paired proteins or phosphorylation sites, and results are shown by scatter plot. Users are free to choose the algorithms used to calculate the correlation, such as the Pearson, Spearman, and Kendall correlation analysis. Moreover, queries for similar expression pattern of proteins or phosphorylation sites are integrated into an interface with the same webpage structure,. this preoecss requires real-time calculation for the correlation of paired proteins or phosphorylation sites, which is time consuming.
Correlation Analysis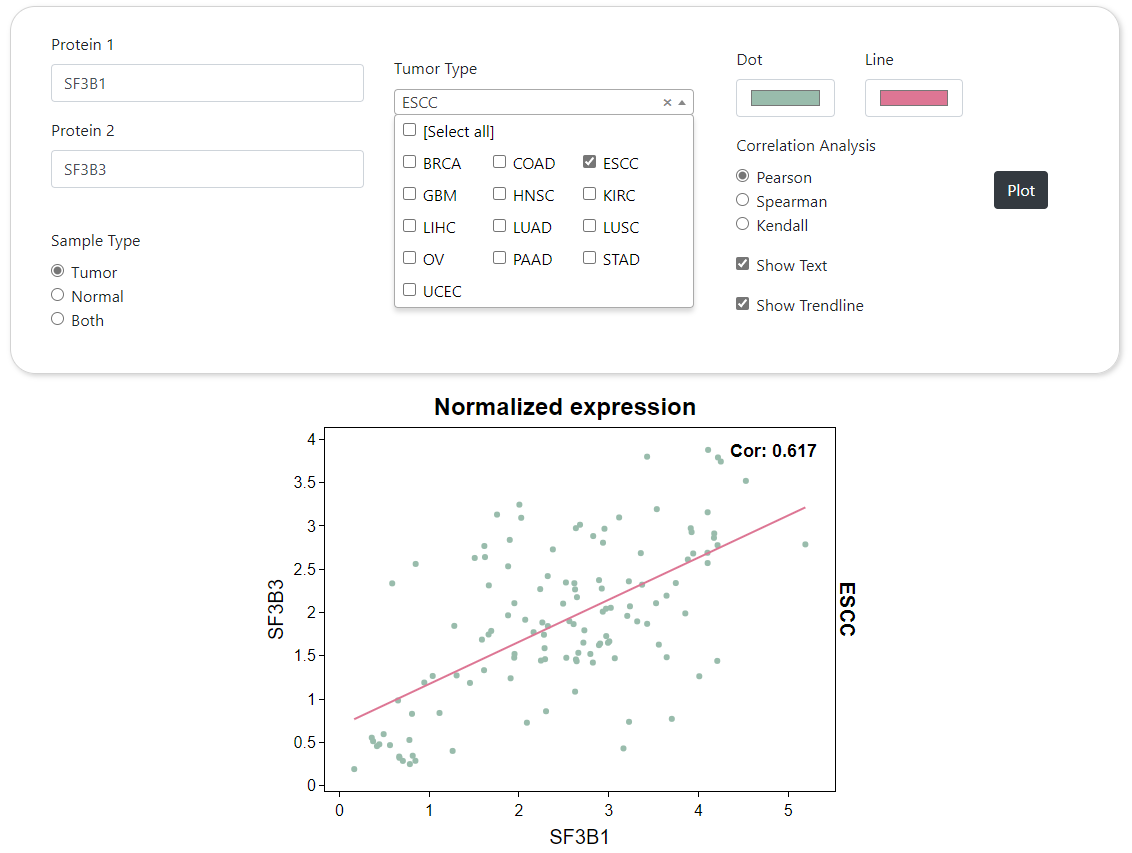
Similarity Profile
Survival Analysis
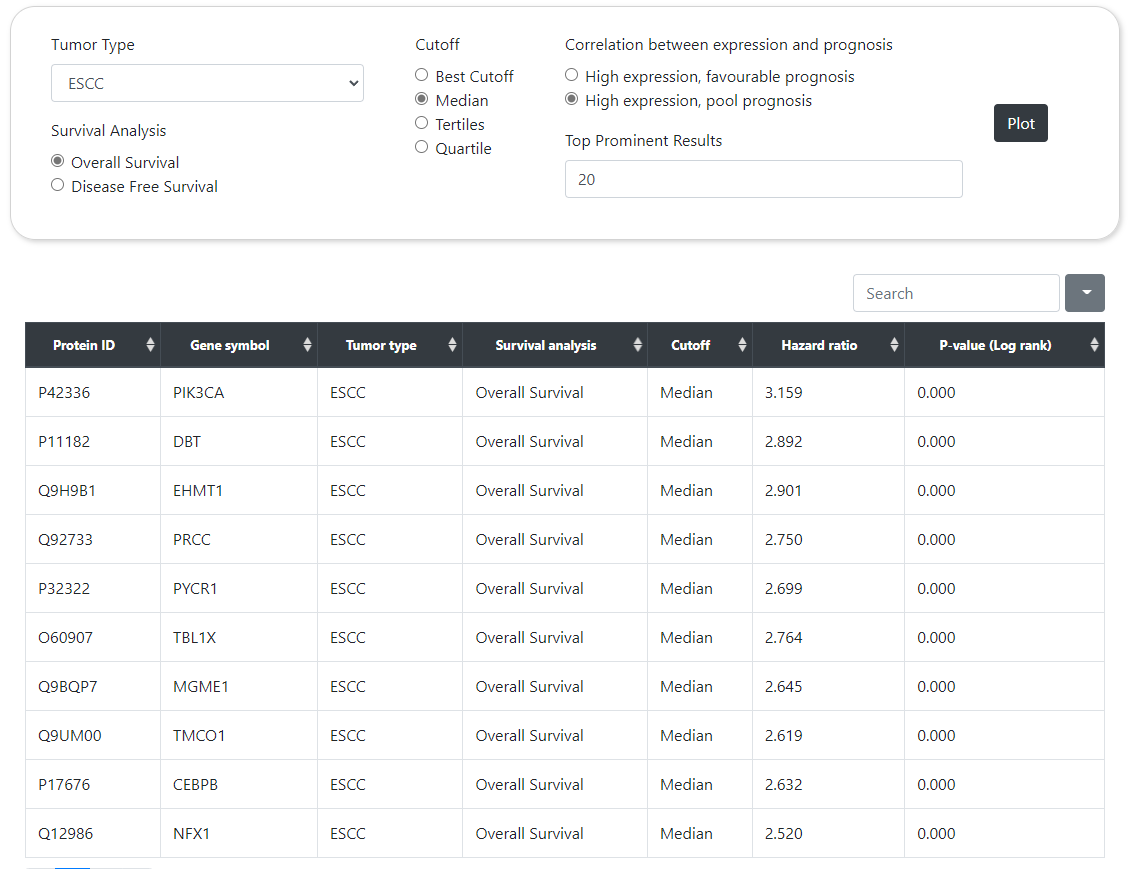
CPPA can provide the survival curves of user-specified protein or phosphorylation site in a given cancer type, in which the Kaplan-Meier (KM) model is used to calculate the survival probability along with death event and survival time. Users can choose different stratification methods, such as Median, Tertiles, Quartile, and Best-cutoff, to classify samples into either high or low expression groups according to abundance. This module also calculates P-value through log-rank test and hazard ratio by cox proportional regression analysis. Besides, users can also choose whether or not to display the 95% confidence interval in survival curves. Similar to correlation analysis, CPPA also provides an interface for screening proteins or phosphorylation sites that are highly or inverse correlated with patient survival status in a given cancer type. The rank of correlation is sorted according to P-value and hazard ratio.
Survival Analysis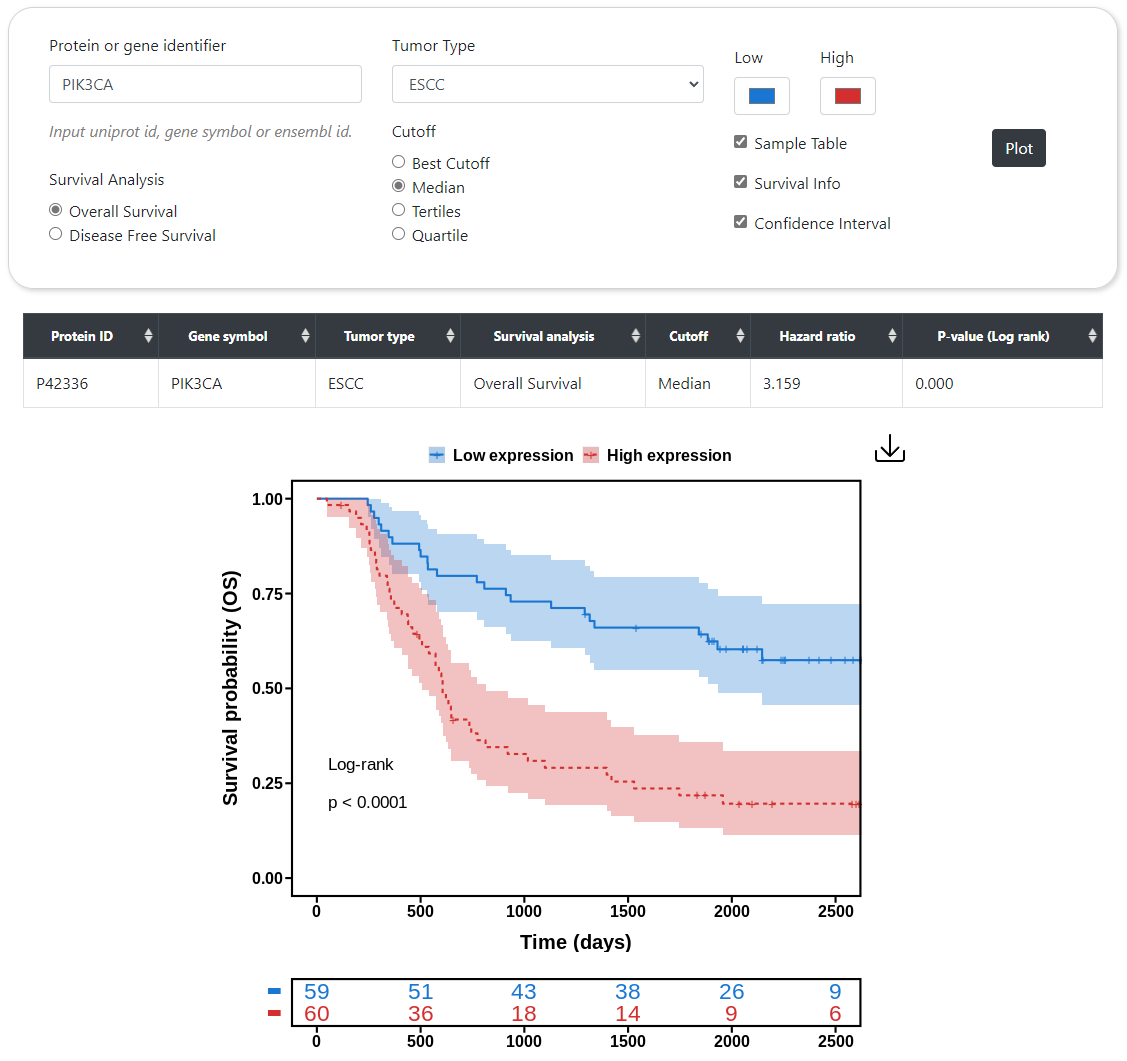
Survival Profile
Supplement
Type of tumor was included in web server
| Tumor code | Detail |
|---|---|
| ESCC | Esophageal squamous cell Carcinoma |
| LUSC | Lung squamous cell carcinoma |
| GBM | Glioblastoma multiforme |
| HNSC | Head and Neck squamous cell carcinoma |
| PAAD | Pancreatic adenocarcinoma |
| LUAD | Lung adenocarcinoma |
| UCEC | Uterine Corpus Endometrial Carcinoma |
| KIRC | Kidney renal clear cell carcinoma |
| LIHC | Liver hepatocellular carcinoma |
| OV | Ovarian serous cystadenocarcinoma |
| STAD | Stomach adenocarcinoma |
| BRCA | Breast invasive carcinoma |
| COAD | Colon adenocarcinoma |
| Tumor | Detail |
|---|---|
| ESCC | Esophageal squamous cell Carcinoma |
| LUSC | Lung squamous cell carcinoma |
| GBM | Glioblastoma multiforme |
| HNSC | Head and Neck squamous cell carcinoma |
| PAAD | Pancreatic adenocarcinoma |
| LUAD | Lung adenocarcinoma |
| UCEC | Uterine Corpus Endometrial Carcinoma |
| KIRC | Kidney renal clear cell carcinoma |
| LIHC | Liver hepatocellular carcinoma |
| OV | Ovarian serous cystadenocarcinoma |
| STAD | Stomach adenocarcinoma |
| BRCA | Breast invasive carcinoma |
| COAD | Colon adenocarcinoma |
1. normalized expression
MaxQuant software (version 2.0.2.0) was used to analyze MS raw files. If the “internal reference”, such as a mixed sample, exists, the reference channel will be set according to the corresponding plex, and the normalization method will be set as ‘Weighted ratio to reference channel’. The expression ratios output by MaxQuant were log2-transformed and normalized using the median centering method across proteins and phosphorylation sites.
2. log2(median)
the meaning of ‘log2 (median)’ represented the log2 transformed median value of normalized expression of proteins or phosphorylation. log2 (median) (N) represented the log2 transformed median value in normal samples. log2 (median) (T) represented the log2 transformed median value in tumor samples.